One of the most common sources of misunderstanding among Meta advertisers centers around the dynamic distribution of budget to various assets. Meta refers to this misunderstanding as the “breakdown effect.”
The danger of the breakdown effect is that it leads advertisers to believe their budget is being misallocated. As a result, they may take manual actions to override Meta’s automation, which typically makes performance less efficient.
This phenomenon is common. In this post, I’ll help you better understand what’s really happening, provide specific examples of the breakdown effect, and explain how you should approach this situation instead.
Let’s get to it…
Breakdown Effect Explained
During the early stages of your campaign, Meta’s ad delivery system enters what’s called the learning phase. This is when it tests different assets to determine which ones are most likely to help you achieve your performance goal. The results you see early on are based on a small sample size and may not predict how things will perform over time.
At first, it might look like one asset is clearly outperforming the others. However, as more data comes in, Meta’s system can detect trends and shifts in performance. It then starts to allocate more budget to the asset it predicts will deliver the best results for your campaign overall, even if that asset didn’t have the lowest cost per acquisition (CPA) at the start.
Because costs tend to rise as you spend more on any given asset, the asset that looked best early on (but received less budget) may end up with a lower average CPA than the asset that got more budget. This can make it seem like Meta is favoring a “worse” performer when in reality, the system is trying to maximize your total results across the entire campaign.
This misunderstanding of budget allocation, and presumption that budget went to a lower-performing asset inappropriately, is what Meta calls the breakdown effect. Let’s discuss some examples.
Example: Placements
Meta uses budget distribution between placements as an example in its official documentation on the breakdown effect. To avoid unnecessary complexity, it provides an overly simplified example for clarity using only two placements.
- Budget: $500
- Placements: Facebook Stories and Instagram Stories
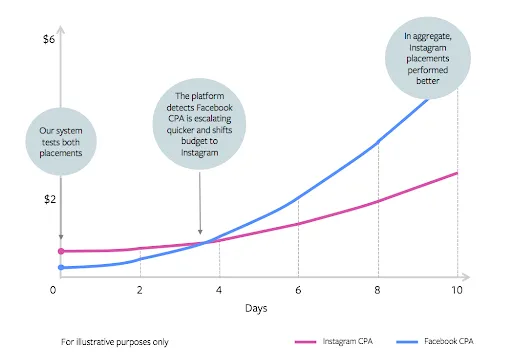
During the early stages, the Facebook Stories placement significantly outperforms Instagram Stories. But there’s an inflection point on Day 4 where Instagram Stories begins outperforming Facebook Stories. Here’s a visualization of that trend.

Meta begins shifting more budget to Instagram Stories. As spend increases, costs naturally increase as well. Of the $500 total budget, $450 would be spent on Instagram Stories and only $50 on Facebook Stories. When looking only at the overall average CPA, it may appear that Meta dedicated more money to the lower-performing placement. This is the breakdown effect.

Since these are averages, they miss the trends. When broken down by day, it’s clearer that Instagram Stories is the top performer over time.

While this example makes the trend obvious, you won’t always be able to point to such clear CPA shifts. The system’s budget distribution can also be driven by projected CPA increases as spend rises, not just by historical results.
Consider another example: Two placements with different inventory potential. Let’s assume you’re using both Facebook Feed and Threads Feed placements. Facebook has about 3 billion active users, while Threads has only 350 million.
You may get a lower CPA from Threads Feed than from Facebook Feed. However, Meta may spend significantly more on Facebook Feed because of the greater available inventory. If you forced all delivery to Threads Feed, your costs would likely rise as the limited audience becomes exhausted and bids increase.
The misunderstanding that Meta incorrectly distributed more budget to Facebook Feed while it appeared to “underperform” compared to Threads Feed is another example of the breakdown effect.
Example: Ad Sets
A similar phenomenon can occur when using multiple ad sets with Advantage Campaign Budget. Let’s assume you are using two ad sets, each with a different targeting approach:
You assign a $100 daily budget that Meta will dynamically distribute between the two ad sets to get you the best results. But after a few days, Meta has distributed 80% of your budget to Ad Set 1, even though its CPA is twice as high.
- Ad Set 1: $4.00 CPA (80% of budget allocation)
- Ad Set 2: $2.00 CPA (20% of budget allocation)
Is Meta incorrectly distributing more budget to the underperforming ad set? That misunderstanding is an example of the breakdown effect.
Meta’s ad delivery system recognizes that the potential audience sizes in these two ad sets are drastically different. The limited audience in the remarketing ad set means you’ll quickly hit diminishing returns, and costs will rise as you try to scale. The algorithm balances that limitation with the much larger audience in the broad targeting ad set, even if the cost per conversion is higher.
Ultimately, the algorithm is driven by the overall goal of getting you the most conversions possible across the entire campaign. It may project that increasing the budget for the remarketing ad set would actually result in higher costs and fewer total conversions.
Example: Ads
This is a common scenario. You have two ads within the same ad set. Early in testing, budget is distributed equally between Ad #1 and Ad #2, and Ad #1 achieves a lower CPA. But as days pass, Meta’s system detects that the CPA for Ad #1 begins to exceed that of Ad #2, so significantly more budget is dedicated to Ad #2.
As more budget is allocated to Ad #2, its costs rise, resulting in a higher CPA. By the end, Ad #2 has consumed 80% of the budget, but its overall average CPA now exceeds that of Ad #1.
The advertiser, seeing that Meta appears to be misallocating budget to the “wrong” ad, turns off Ad #2. This is a classic example of the breakdown effect.
When the advertiser turns off the second ad and dedicates all of the budget to Ad #1, costs will likely increase. More than likely, the end result will be an overall higher CPA than when using both ads with Meta’s automated budget allocation.
Meta’s goal is to get you the most results possible in aggregate, as defined by your performance goal, across all of your ads within an ad set. The system balances trends and predicted costs of all ads to achieve this.
Recommended Approach
A common theme in my recommendations is reflected here: Prioritize a hands-off approach over micromanagement. Look beyond the surface-level, average CPA of individual assets when evaluating why budget was allocated the way it was.
Focus on results in aggregate, rather than isolating individual assets. For example, when using:
1. Multiple Ad Sets with Advantage Campaign Budget: Prioritize aggregate campaign performance, rather than the performance of individual ad sets.
2. Advantage+ Placements: Prioritize aggregate ad set performance, rather than the performance of individual placements.
3. Multiple Ads within an Ad Set: Prioritize aggregate ad set performance, rather than the performance of individual ads.
This doesn’t mean the algorithm is perfect, but constant micromanagement of budget allocation is unlikely to improve performance. In most cases, it will actually make delivery less efficient.
Your Turn
Do you have any other examples of the breakdown effect?
Let me know in the comments below!